The Cost of Not Having a Client Engagement Platform Is Higher Than You Think
8 min Read
Most enterprise RIA leaders frame the client engagement technology decision as a cost-benefit analysis. What does the platform cost, and what does it deliver? It is a reasonable framework. It also skips the question a finance-trained operator should ask first.
What is the firm already paying for the absence of a systematic engagement capability?
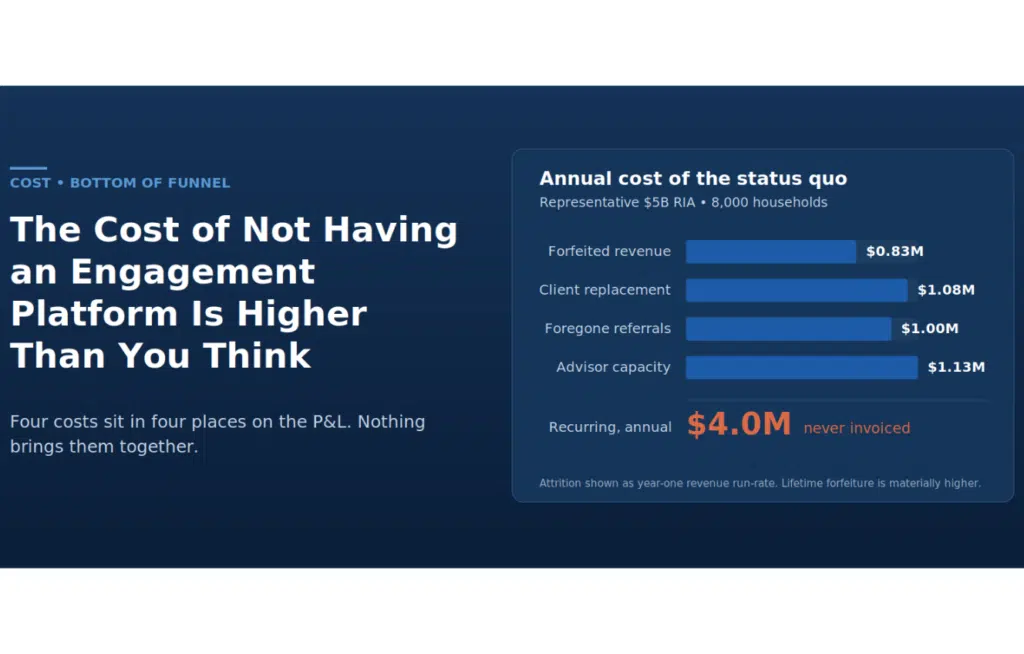
For PE-backed firms under pressure to show organic growth and AUM retention, that number is large. It is also invisible. The cost sits in four separate places on the P&L, and nothing brings them together.
| $10,408
Median client acquisition cost at advisory firms above $5M in annual revenue, 71% of which is advisor and staff time (Financial Planning, 2026) |
3 in 4
Advised clients who left or considered leaving their advisor in 2023, with communication a leading factor (YCharts Advisor-Client Communication Survey, 2024) |
Why the Status Quo Has No Line Item
Every major firm decision gets a budget line. The status quo does not.
Attrition is owned by client service. The growth shortfall is owned by marketing. Advisor time sits inside compensation. Replacement cost is hidden in the marketing budget. Each one is somebody’s problem. The sum is nobody’s.
So the investment committee sees a lopsided comparison. On one side, a platform with a price. On the other, a status quo that appears to cost nothing. Framed that way, the platform loses every time.
The rest of this piece prices the other side.
Cost One: Attrition Measured Against the Right Benchmark
RIA client retention is genuinely strong. Schwab’s benchmarking data has held at 97% for a decade. That figure is also why the cost was waived off. Three percent sounds like a rounding error.
At enterprise scale, it is not. And scale works against you, not for you.
The Ensemble Practice surveyed advisory firms on 2023 operating results. Large firms, those above $1B in AUM, lost 4.3% of their clients that year. Medium firms lost 3.3%. Small firms lost 1.4%. (These are 2023 figures, the most recent segmented data available.) Bigger firms shed more clients, not fewer.
Work out the arithmetic for a representative enterprise firm. Take 8,000 client households at $800K average AUM. At a 1% advisory fee, each household generates $8,000 a year.
Assume the firm runs at the 4.3% large-firm average. Assume best practice is the 3.0% implied by the industry retention rate. That 1.3-point spread is 104 households a year.
A retained household has roughly 12 years of expected remaining tenure. Each premature departure therefore forfeits about $96,000 in gross revenue. Across 104 households, one year’s excess attrition forfeits close to $10 million in lifetime revenue. Next year produces another cohort.
One caveat worth stating to a CFO before they raise it. That is gross revenue, not margin, and it is undiscounted. Apply a discount rate and a margin assumption, and the figure comes down materially, but it remains a seven-figure annual charge.
The question isn’t what a client engagement platform costs. It’s what the absence of one is costing — in attrition, in organic growth left uncaptured, and in advisor time diverted from high-value work.
Cost Two: Replacing the Client You Just Lost
Forfeited revenue is only half of an attrition event. The other half is replacement.
Client acquisition cost rises with firm size. It does not fall. Firms under $250K in annual revenue acquire a client for roughly $1,064. Firms above $5M spend $10,408. Advisor and staff time accounts for 71% of that cost.
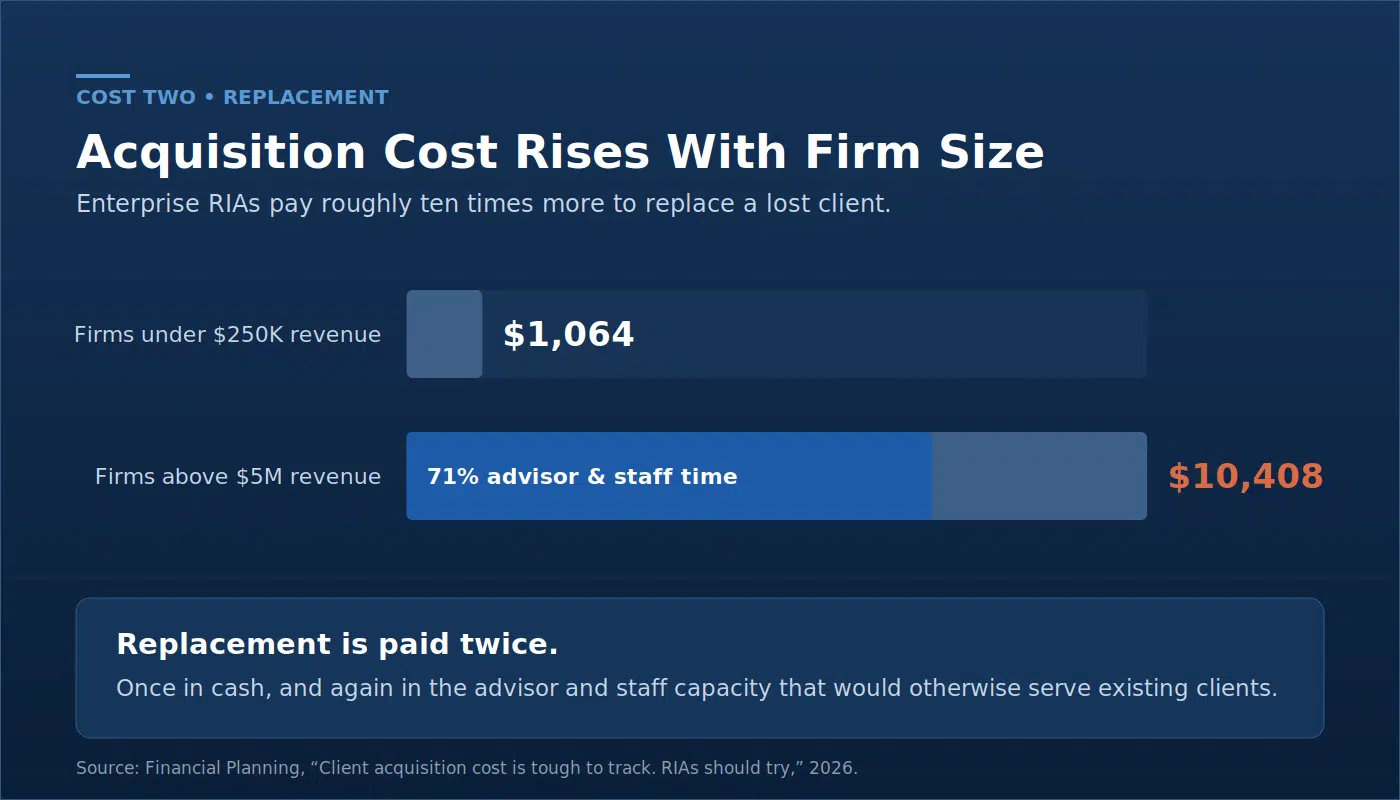
That last detail matters. Replacement is paid twice. Once in cash, and again in capacity taken from the people who serve existing clients.
Apply the enterprise CAC to the 104 excess departures above. Standing still costs roughly $1.1 million a year in acquisition spend alone.
And the two clients are not equivalent. The departing household was mature, referring, and fully onboarded. The replacement starts at year zero.
Cost Three: The Organic Growth That Never Happens
Referrals are the growth engine, and the data on this is unambiguous. Schwab’s 2024 benchmarking study found that client and centre-of-influence referrals drove 67% of new clients and new client assets in 2023.
Referrals track communication closely. In YCharts’ survey of roughly 800 advised clients, 89% said that more frequent or personalized communication would make them more likely to refer their advisor.
Most firms leave this to chance. Schwab’s 2026 study found that fewer than half of firms with above $250M in AUM have a documented client referral plan. Only 30% have one for centers of influence. Firms that do have plans generate 1.6 times more new client assets than firms that do not.
Size the gap on a $5B firm. Referral-sourced new assets running at 2% of AUM are $100 million a year. At 4%, it is $200 million. The two-point difference is $100 million in new AUM, or $1 million in recurring revenue at a 1% fee.
The mechanism is simple. A referral requires the client to have something worth forwarding. A quarterly statement is not that.
Cost Four: Advisor Capacity Spent on Manual Communication
Advisors do not have spare hours. Kitces Research found that the typical advisor spends only about 20% of working time in client meetings. Roughly 45% goes to behind-the-scenes preparation, planning, analysis, and investment work. Fidelity’s research puts it more bluntly. Advisors spend four hours of every ten supporting clients and prospects. The other six go to administration, compliance, and other non-client duties.
Manual client communication draws down an already thin margin.
Model it conservatively and transparently. Take 150 advisors at a $150K fully loaded cost. On a 2,000-hour year, that is $75 an hour. At two hours a week of communication work, a platform would be systematized; the firm spends 15,000 hours and $1.1 million a year. At three hours a week, it is 22,500 hours and $1.7 million.
This estimate is linear in the hours assumption, so it is the one input worth measuring rather than assuming. Time-tracking data from a single advisor pod will beat any industry average.
The deeper cost is where those hours come from. They are drawn from the highest-value work an advisor does, not the lowest.
Add forfeited revenue, replacement cost, foregone referral growth, and advisor capacity. For most enterprise RIAs, the total is a recurring seven-figure charge that appears nowhere in the budget.
Four Costs, One Root Cause
These are not four unrelated problems. They share a driver. Client communication that is inconsistent, manual, and impossible to run at scale.
The chain is visible in the survey data. Among clients contacted infrequently, 22% felt very comfortable with their financial plan heading into a downturn. Among clients contacted monthly or more, 71% did. Nearly four in five want contact at least quarterly.
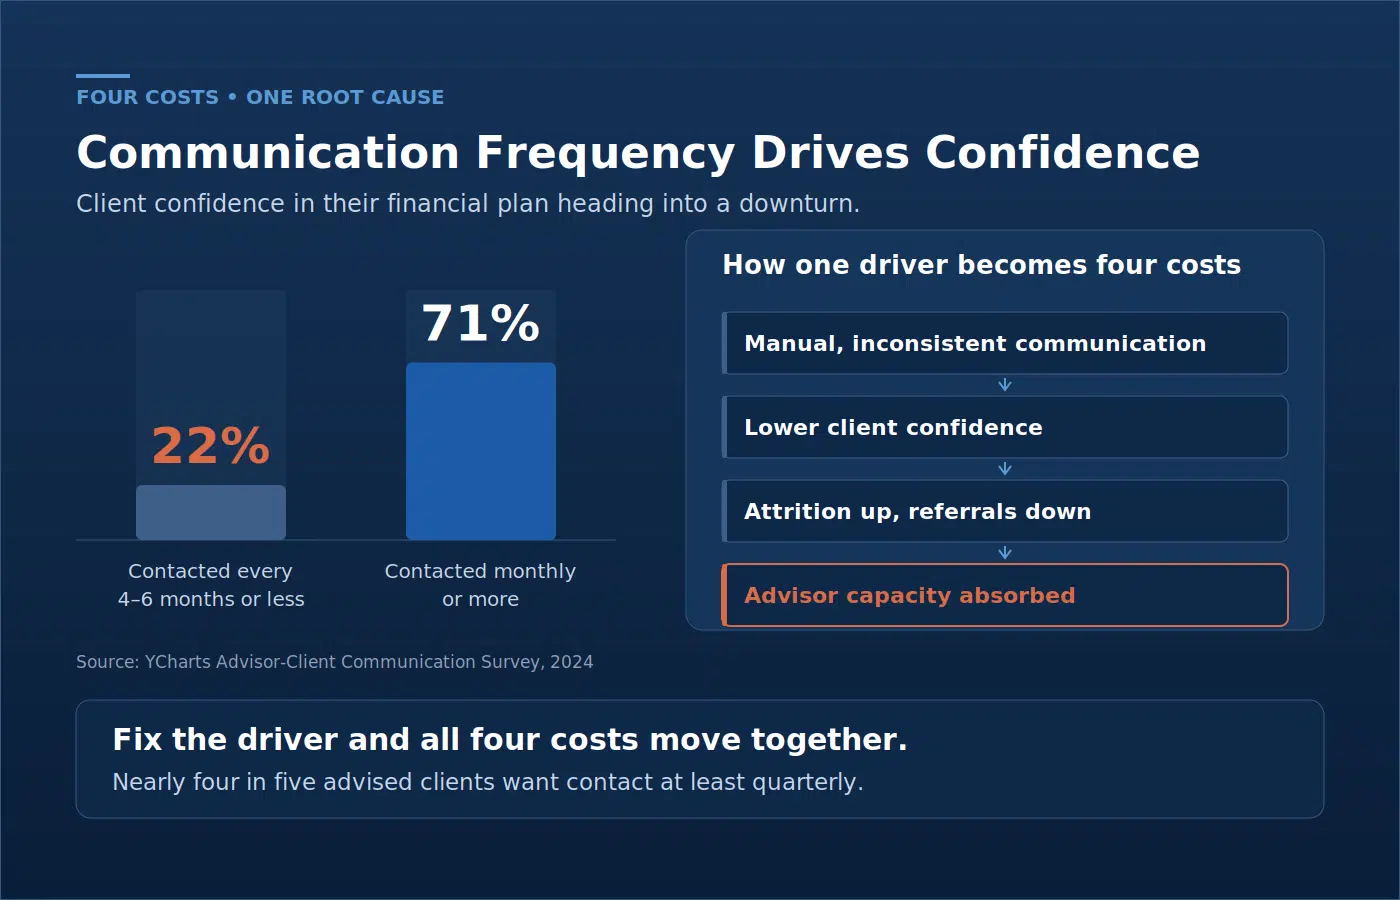
Confidence drives retention. Retention protects referrals. Referrals drive organic growth. And the manual effort of holding it together drains the capacity that would otherwise deepen those relationships. Fix the driver, and all four costs move together.
Sizing This for Your Own Firm
Four numbers produce the baseline. The firm already has all of them.
First, the attrition spread. Take your household attrition rate, subtract a credible best-practice rate, multiply by household count, average annual revenue per household, and expected remaining tenure.
Second, replacement cost. Multiply the same household count by your loaded client acquisition cost.
Third, the referral gap. Compare referral-sourced new assets as a share of AUM against a peer with a documented plan, then apply your fee rate.
Fourth, capacity. Advisor headcount, times weekly hours on manual client communication, times loaded hourly cost, times fifty weeks.
None of this requires a vendor conversation. All of it should be finished before one starts.
The Comparison That Actually Matters
With that baseline in hand, the platform question changes shape entirely.
It stops being a question about what a platform costs. It becomes a question of what the current arrangement costs and whether it is cheaper. For most PE-backed enterprise RIAs, once the four numbers sit on a single page, the comparison is not close.
The status quo has been billing the firm for years. It has simply never sent an invoice.
If you want to run the four-number baseline for your own firm, we can help you build it. [Request a Demo]
SOURCES
Client retention 97%, referrals 67% of new clients and new client assets (2023 data): Charles Schwab, 2024 RIA Benchmarking Study (1,304 firms); retention confirmed across 2014–2024 in the 2025 study.
Documented referral plans (44% client, 30% centre-of-influence) and 1.6x new client assets: Charles Schwab, 2026 RIA Benchmarking Study (1,236 firms, $2.5T AUM).
Client attrition by firm size (4.3% large, 3.3% medium, 1.4% small): The Ensemble Practice 2023 operating survey, reported in Financial Advisor magazine, November 2024. 2023 data.
Client acquisition cost ($1,064 under $250K revenue; $10,408 above $5M; 71% staff and advisor time): Financial Planning, “Client acquisition cost is tough to track. RIAs should try,” 2026.
Advisor time allocation: Kitces Research on Advisor Productivity; Fidelity 2024 RIA Benchmarking Study and 2025 Advisor Insights Study.
Client communication and retention data: YCharts Advisor-Client Communication Survey 2024 (approx. 800 advised clients, fielded February 2024). Note: YCharts sells advisor communication tools and the survey used an incentivized respondent panel. Treat as directional.