How to Present Client Engagement Technology to Your Board: An ROI Framework for Enterprise RIAs
6 min Read
Most client engagement technology requests do not fail at the investment committee. They stall. The committee asks for more information, the decision moves to next quarter, and the sponsor loses the room.
That outcome is rarely about the platform. It is about translation. Boards and PE operating partners evaluate capital requests in the language of financial return, risk reduction, and the value creation thesis. Engagement metrics and feature comparisons do not survive that translation.
What follows is the framework for making it. Launch Sequence #13 established what the absence of engagement infrastructure costs a firm. This is how to put that number in front of a board and walk out with a decision.
Three ROI Drivers
Organic growth acceleration • Advisor capacity recovery • Acquired-cohort retention — in that order, for a board-ready engagement platform ROI model.
Frame the Baseline First
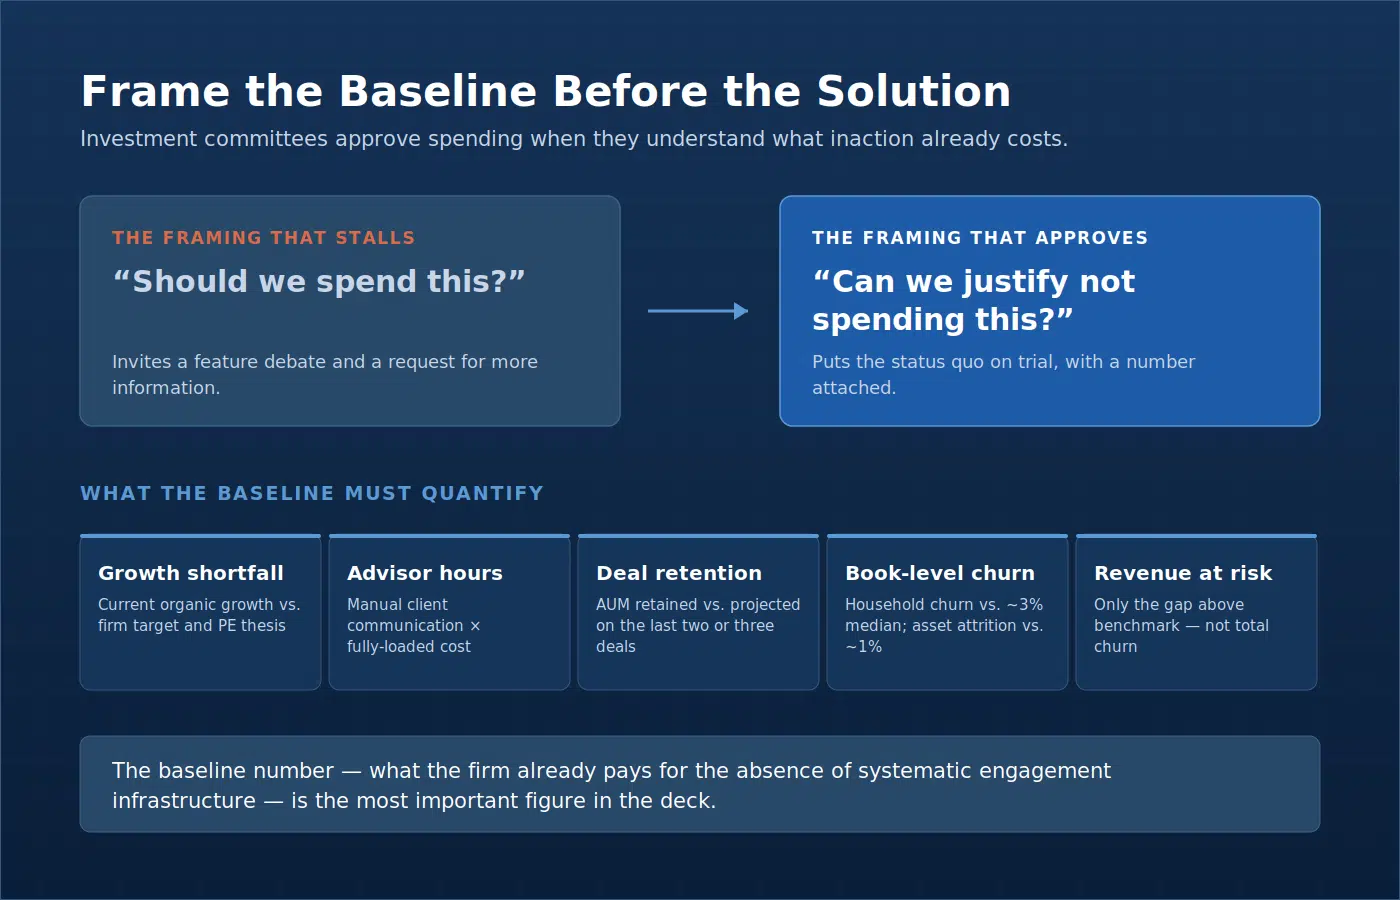
Establish the cost of the current state before presenting a solution. Investment committees approve expenditures when they understand what inaction is already costing.
The baseline for a client engagement ROI analysis should quantify:
- Current organic growth rate against both the firm target and the PE growth thesis
- Advisor time spent on manual client communication (hours per week per advisor × fully loaded cost)
- Post-acquisition retention on the last two or three deals (AUM retained against projected)
- Book-level churn against the benchmark median — currently around 3% of households annually, but closer to 1% of assets once growth is netted against it [Source: Schwab RIA Benchmarking Study — confirm edition and vintage with Rob before publication]
- The revenue attached to the gap above that benchmark, if there is one — not the revenue attached to total churn
The resulting number — what the firm already pays for the absence of systematic engagement infrastructure — is the most important figure in the deck. It reframes the conversation from “should we spend this?” to “can we justify not spending this?”
The most effective investment cases don’t lead with what the platform does. They lead with what the status quo is costing — in dollars, in attrition, and in growth left on the table.
The Three-Driver Model
Build the model on three drivers, in this order. Each is independently quantifiable, and each traces to a line the CFO already tracks. Lead with growth: it is the driver the sponsor underwrote the firm on, and it does not require the board to first accept that the firm has a problem.
To keep the illustration honest, every figure below runs off a single model firm: $5B in AUM, 6,250 households at $800,000 average, a 1% blended advisory fee, and 150 advisors. Substitute your own inputs; the structure holds.
Driver 1: Organic growth acceleration. Model the growth contribution of higher engagement. A firm at 2% organic growth against a 5% target carries a three-point gap; closing half of it adds $75M in new AUM, or $750,000 in annual fee revenue. This driver rests on an engagement-to-referral relationship, so carry your own referral data into the model rather than an industry multiplier. [Sourcing: the referral-lift claim needs a named study and vintage before publication — flagging for Rob.]
Driver 2: Advisor capacity recovery. Model the advisor hours returned when systematic delivery replaces manual outreach. At three hours per advisor per week, 48 working weeks, half of that time recovered, 150 advisors, and a $150,000 fully loaded cost against 2,000 annual hours, that is roughly $810,000 in recovered capacity. Recovered capacity is real, but it is not revenue until the firm redeploys it, and a CFO will say so before you do. Show that split yourself.
Driver 3: Acquired-cohort retention. This is the driver to scope narrowly, because at the book level it usually is not there. Benchmark household churn runs around 3% a year and asset attrition closer to 1%, so unless the firm is meaningfully above that, there is no retention gap to monetize and claiming one costs credibility.
Recently acquired households are the exception. Attrition through the integration window runs above steady-state, and it lands on assets the firm has already paid for. Size this driver on the firm’s own last two or three deals rather than an industry figure. For a model firm carrying $1.2B in AUM acquired inside the integration window, cutting cohort attrition by 1.5 to 3 points retains $18M to $36M in AUM, or $180,000 to $360,000 in annual fee revenue.
If the firm is not in acquisition mode, drop this driver rather than stretching it. Two well-defended drivers beat three with a soft one attached.
| ROI Driver | Conservative Case | Moderate Case |
|---|---|---|
| 1. Organic growth acceleration (new AUM × fee) | $500K | $750K |
| 2. Advisor capacity recovery (not P&L until redeployed) | $430K | $810K |
| 3. Acquired-cohort retention (recurring revenue) | $180K | $360K |
| Total modeled annual value | $1.11M | $1.92M |
| — of which recurring revenue | $680K | $1.11M |
Run the total against the firm’s actual quoted platform cost to produce payback period and first-year return. Present both cases, not the moderate one alone. Showing the conservative floor lets the committee test how much the result depends on your assumptions, and an investment that still clears the hurdle at the low end is much harder to defer.
Address the Value Creation Thesis Directly
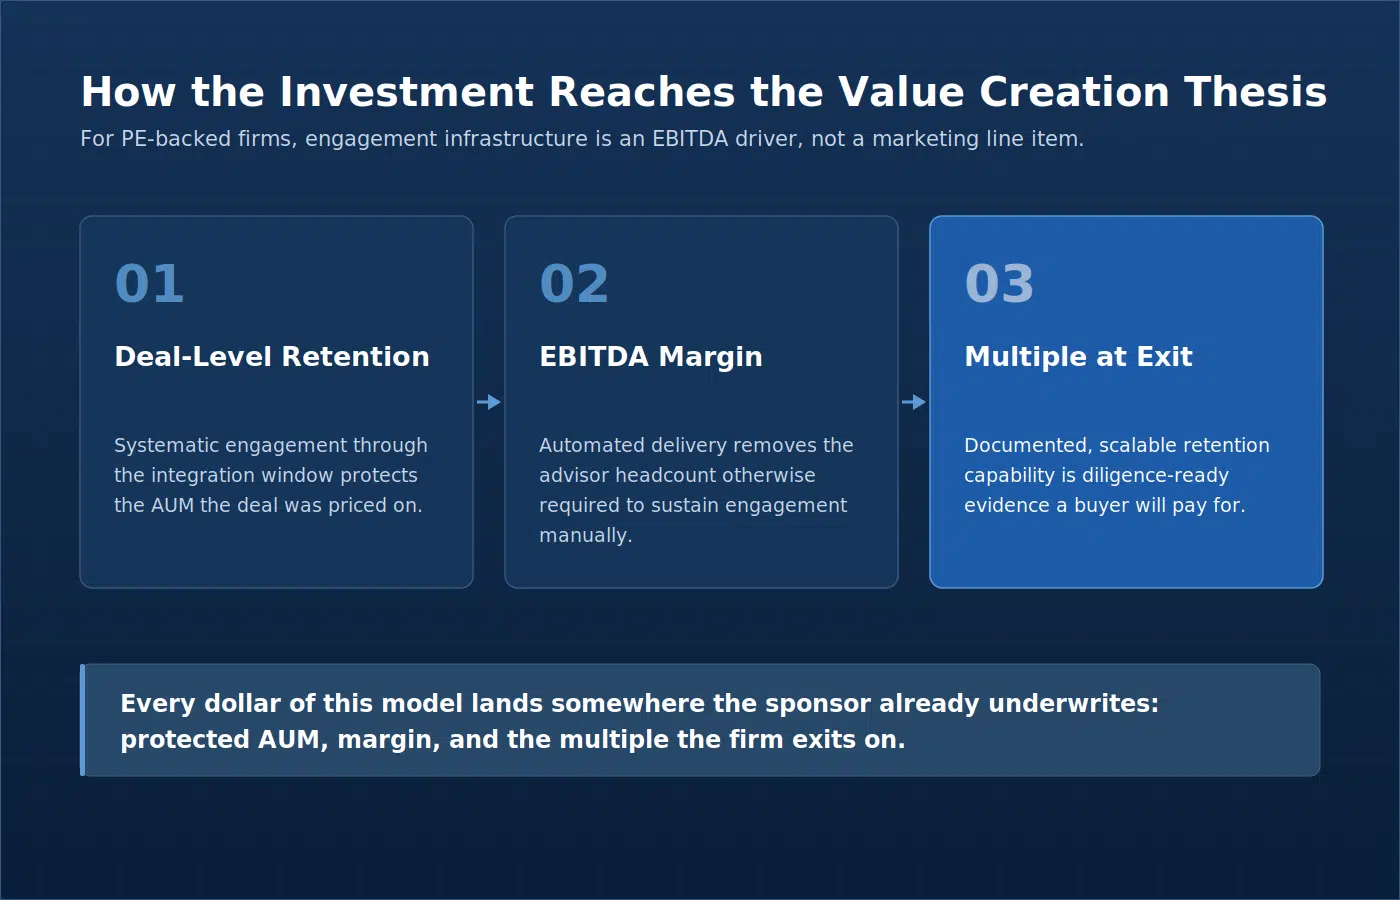
For PE-backed firms, the committee will want to understand how engagement infrastructure affects the acquisition thesis. The answer runs in three steps.
It protects deal-level retention. Post-acquisition attrition erodes the AUM the deal was priced on. Retention through the integration window converts directly into realized value per dollar of consideration.
It improves EBITDA margin. Firms that automate systematic client delivery at scale carry less advisor headcount for the same engagement level than firms funding that engagement with advisor time.
It is a value driver at exit. Documented, scalable engagement infrastructure with above-benchmark retention is diligence-ready evidence. A firm that can demonstrate systematic client retention is underwriting a different multiple than one that cannot.
PE sponsors increasingly treat client engagement infrastructure as an EBITDA driver, not a marketing expense. The firms that build it early capture that multiple expansion at exit.
Anticipate the Four Questions
Build the presentation around the questions the committee will ask rather than the ones you would prefer to answer. For an engagement technology investment they are consistent: How do we measure success? What is the payback period? How does this integrate with the existing technology stack? And what is the cost of exit if it does not work?
Come with the answers already in the deck. Success is measured on attrition rate, engagement delivery rate, organic growth contribution, and advisor time. Payback is calculated from the model above against quoted cost. Blueleaf Engage integrates with existing CRM and portfolio management systems without a rip-and-replace. And deployment risk is contained by a phased rollout that begins with one or two acquired firms before scaling platform-wide.
A question you have to take away is a decision you have to come back for.
Sizing This for Your Own Firm
Replace the model firm’s inputs with six of your own: household count, average AUM, blended fee, advisor headcount, current attrition rate, and current organic growth rate. Those six numbers produce the baseline and all three drivers. The framework does the rest.
Blueleaf Engage provides enterprise RIA leadership teams with the deployment data, benchmark comparisons, and integration documentation needed to build a board-ready investment case — and the platform to execute on it once approval is secured.