Which Clients Are Actually Carrying Your Practice?
10 min Read
Every advisor knows what the firm made last quarter. Far fewer can say which clients produced it, at what rate, and whether that rate still makes sense. Your billing system has had the answer the whole time. It was never built to show you.
Posted by Connor Prendergast
Ask an advisor what the firm made last quarter and you’ll get the number to the dollar.
Of course you will. It’s the top line. Their own pay comes out of it. They knew it the day the debits cleared.
Now ask which ten clients produced most of it.
That one takes longer. There’s a pause, a guess at three or four names, and then a spreadsheet gets opened.
That’s the gap. Not the number. What’s inside it?
Why most advisors judge their clients by instinct
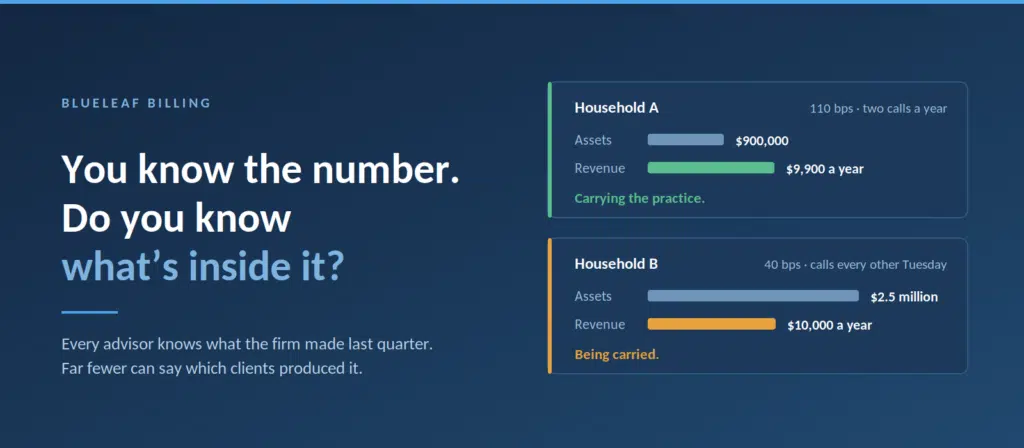
Take two households. One pays 110 basis points, and you speak to them twice a year. The other pays 40, on a legacy rate nobody has revisited since 2016, and calls every other Tuesday.
One of them is carrying out the practice. The other is being carried. Most advisors can tell you which is which without looking anything up.
Now put assets on it. Say the first household has $900,000 with you and the second has $2.5 million, which is why the second has always been described around the office as one of your biggest relationships. At 110 basis points, $900,000 pays $9,900 a year. At 40, $2.5 million pays $10,000.
Nearly three times the assets. The same revenue. Several times the phone calls.
You probably had a sense of that already. What you didn’t have was the two figures side by side. Instinct can tell you something is off. It can’t tell you by how much, and it can’t tell you how many other households in your book look the same.
Here’s what makes this strange. Your billing system worked out every one of those fees. It does it every cycle, for every client, to the cent. It has been holding the full composition of your revenue for years.
Your billing system already knows what every client pays you. Then it hands you a file for the custodian and stops.
So advisors rebuild the picture by hand. One advisor we talked to works out their own effective rate every cycle, setting what was billed against the assets it was billed on. Another, shown two billing cycles side by side for the first time, said they’d been making that comparison manually.
Neither of them was missing data. They were missing a place where it was laid out.
That’s the problem. Here’s how Blueleaf Billing solves it: the revenue dashboard is built from the billing run itself, so the fees on the screen are the fees that went to the custodian. They’re laid out by the client first, then by advisor, against any other period you’ve billed.
The revenue dashboard puts every client in one table
The dashboard reports one billing period at a time, and you choose a second period to measure it against.
The figures are current as of this morning, automatically, not as of the last time someone ran billing. Advisors used to run a cycle mid-quarter just to see where revenue stood, and broke things doing it. That’s no longer needed, you can simply open and look.
Five figures run across the top: firm AUM, revenue for the period, annualized revenue, average fee rate, and how many of your clients billed. Below them are three charts. Revenue period by period. Revenue by advisor. Revenue by the kind of fee schedule each client is on, flat or tiered.
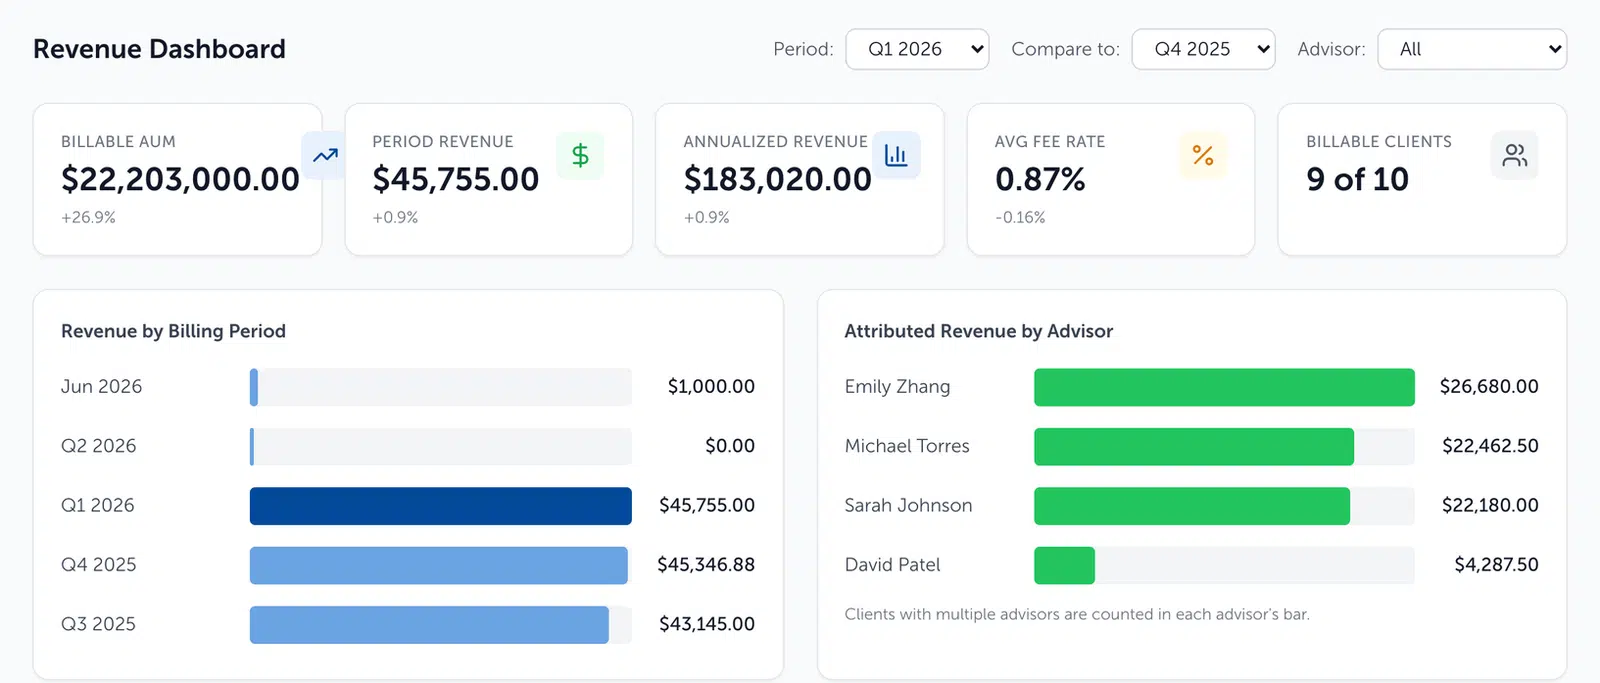
The firm for one period, measured against any other.
Those are the numbers you already knew, or nearly. The table underneath is the one you didn’t have.
Client Revenue Detail lists every client in the period. Their assets. The schedule they’re on. What they paid. Their annualized rate. Their share of the firm’s revenue. Their primary advisor. And the change since the comparison period. Click any column heading and the whole book sorts by it.
The rate column deserves a second look, because it isn’t the rate printed on the fee schedule. It comes out of the run: what the client was actually billed, measured against the assets it was billed on. The tier they landed in, the cap on their fee, the one account billing on a different schedule, the arrangement you grandfathered years ago. All of that is already in the figure. It’s their effective rate: the rate they really pay.
One thing to know when you read it. Assets here means billable assets. An account you’ve excluded from billing adds nothing to either side, so a client billed on part of what they hold with you shows that part.
What you find the first time you sort by effective rate
Click the rate heading and something usually happens.
There’s a client near the bottom you’d forgotten was down there. An arrangement made for a reason that was good at the time, and not looked at since.
There’s a relationship you’ve always called one of your biggest. It is big, in assets. In the share of revenue column, it’s ordinary. That’s the $2.5 million household, carrying the same share of revenue as the $900,000 one.
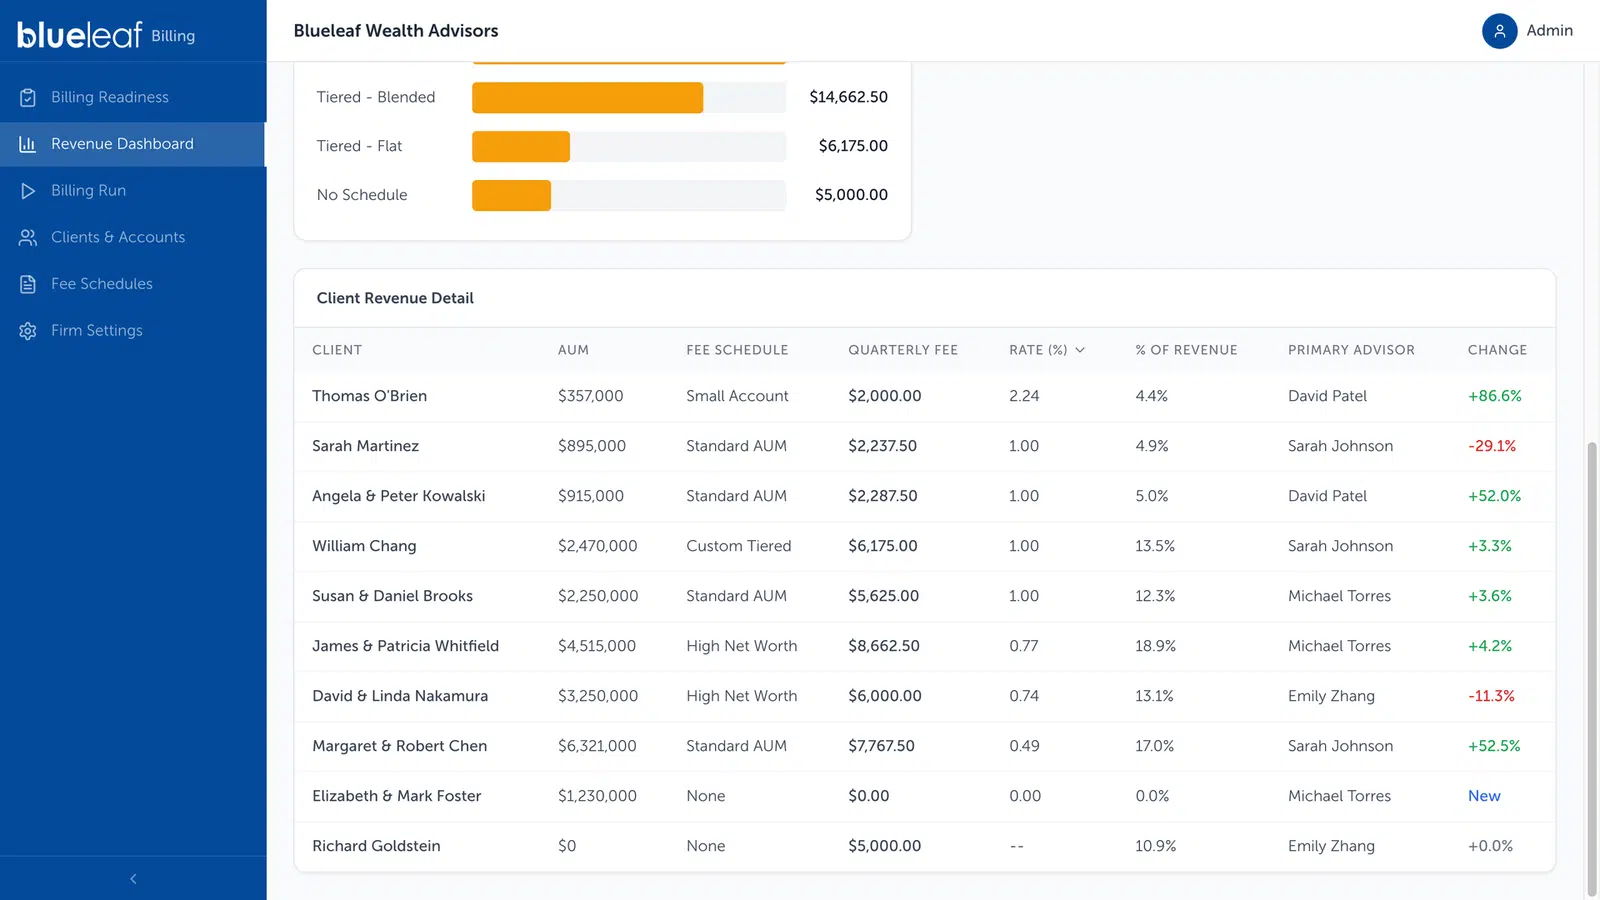
The whole book, ranked by the rate each client really pays.
Sort by share of revenue instead, and you have the answer to the question this article opened with. The ten names at the top are the ten that decided your quarter. Keep going and count how many rows it takes to reach half your revenue.
The dashboard also raises one group without any sorting at all: clients carrying a maximum fee cap. That’s a ceiling somebody set on purpose and may not remember setting.
Every figure in that table was already sitting in your billing system.
Nothing was hidden. Nobody had ever laid it out.
The pricing decisions you can make once you see the whole book
Once the book is laid out, you can start answering questions you used to answer by instinct.
Start with which relationships pay for themselves. The table gives you half of that: what each client pays. The other half, what they take to serve, you already carry around in your head. One advisor we talked to had just spent weeks working through problems with a difficult client and wanted to know what the relationship was actually worth. The answer was on the screen: less than 1% percent of the firm’s revenue. That number doesn’t decide anything. It does turn a frustration into a question you can answer.
It also corrects a habit. When advisors trim a book, they tend to start with the smallest clients. Set a minimum, cut everyone under it. But small and poor fit aren’t the same thing. A $75,000 client who suits the way you work is just small. A $400,000 client who takes more of your time than a $3 million client is the one worth a hard look, and no asset minimum will ever point at them.
Then there’s where you’re undercharging, and by how much. Go back to the household at 40 basis points. If your current schedule would put $2.5 million at 85, that relationship pays $10,000 a year where a new client with the same assets would pay $21,250. The gap is $11,250 a year. Nobody chose that figure. It accumulated.
A legacy rate starts as a favor. Left alone long enough, it becomes a subsidy.
The fee break you granted in 2019 may still make perfect sense in 2026. The client may have referred half your book. The point is to decide it, not to inherit it.
These are pricing decisions, and most advisors make them on instinct, because the numbers to make them properly were never in one place.
And when you do decide to change something, you change it where it holds. A different schedule on the client. An exception on a single account. A minimum fee on the client, so a small relationship that takes real time pays a floor. Set it once, and the next run bills that way without anyone remembering to fix it.
The same analysis works for every advisor at the firm
Everything the table does for clients, the dashboard does for advisors.
An Advisor control sits at the top of the page. Pick a name and the whole page narrows to that advisor’s clients: the five figures, the charts, the table. Set it back to All and you have the firm again. The revenue by advisor chart ranks everyone by the fees of the clients they’re primary advisor on.
So you can see who produced what. You can see the assets each advisor carries next to the revenue those assets generate, and whether the two match. You can see how each one’s production moved against the comparison period. And you can see each advisor’s own average fee rate, which is where you find out that one of them discounts and one of them doesn’t.

One advisor’s book, already totaled.
That one view answers two different questions.
The immediate one is payment. One advisor we talked to pays a second advisor in the office every month on the clients that advisor manages. On the old system, that meant pulling up thirty-odd accounts, exporting them to a spreadsheet, totaling the column, and cutting a check from the total. Another firm wanted the same view for a slightly different reason: something to show the advisor being paid, and a check on their own math. Now it’s a figure on a screen.
Be clear about what that figure is. It’s the revenue from the clients each advisor is primary on. It doesn’t divide one client’s fee between two advisors, and it doesn’t calculate a payout. Your payout formula is still yours. What disappears is the export and the adding up.
There’s one dependency. An advisor has to exist as a user in Blueleaf, with clients assigned to them, before they appear. The advisor in that story opened the dashboard and found the person they pay every month missing from the list, because that person had never had a login of their own. The assignment is made in Blueleaf, not in billing, and it’s worth getting right before your next run.
What’s coming next: comparing your firm against its peers
Everything above compares you against yourself. This period against another. One client against the rest of the book. One advisor against the firm.
The next step is comparing you against everyone else. We’re working on benchmarking, so you can set your revenue and your fee schedules beside firms of similar size. It isn’t in the product yet, and we’ll say so when it is.
Knowing your effective rate is useful. Knowing it against your peers is a different kind of useful.
In the meantime, the simpler point stands. A calculator hands you a number and stops. A billing system that holds every fee, every client, and every period can tell you which clients carry the practice, which advisors produce the revenue, and which rates stopped making sense years ago.
You know what you made last quarter. Now you can see who made it.
See your own book sorted by effective rate in a 30-minute walkthrough. Request a Demo
Blueleaf Billing calculates fees continuously, flags what needs attention before the cycle closes, shows the full calculation behind every client’s fee, and lays out your revenue by client and by advisor against any period you’ve billed. Billing that’s obvious to anyone at the firm, and useful to the person running it.